
Applying an Intersectionality Lens in Data Science

Photo by Jesús Mirón García from Pexels
–By Rachel Whaley & Daphne Cheung, presented at Data Con LA
Data analytics is all about asking good questions and seeking informed answers that address a real need. But how do we decide which questions to ask and whose needs are prioritized?
Intersectionality, or overlapping identities of race, gender, and other factors that have historically experienced discrimination, is a useful framework to guide the design and execution of data science projects across industries and subject areas.
An intersectionality framework challenges us as data professionals to look more deeply at the structural and systemic underpinnings of the data and unpack assumptions around how the data is collected, analyzed, and presented in its context. At every stage of the data science project lifecycle, an intersectionality lens supports equitable results by enabling us to account for all identities and address power dynamics within the scope of the project.
Unfortunately, there are countless examples of data science resulting in inequitable outcomes, such as search engines advertising higher-paid jobs to men than women, or chatbots perpetuating harmful stereotypes learned from biased training data. An intersectionality lens fights these kinds of injustices, addresses underlying systemic issues, and ultimately fosters equitable outcomes for everyone.
What is intersectionality?
Intersectionality works like a Venn diagram: if you draw a circle for each dimension of your identity (categories that might include race, ethnicity, gender, and a variety of other attributes) they all overlap in the middle, and they also all overlap with each other to create intersecting identities. Each combination of intersecting identities represents a potentially different experience for an individual. These potential differences (some negligible, some significant) inform the needs, experiences, and interests of people at each intersection point of these identity groups.

An example of a Venn diagram representation of identity
Consider, for example, two women who work in the same job for the same employer. These two individuals have a few identity attributes in common (a few of the same circles in their Venn diagrams) that might lead them to have similar experiences and needs in a particular context. Looking at additional data about these two individuals, however, starts to paint a multidimensional picture of each person and all the different ways that their individual identities intersect. For example, one woman could be a parent of two young children, in her early fifties, who has a physical disability, and the second woman might be a queer Latina woman from a high-income background who just graduated from college. These factors, along with many other aspects of both of their identities, shape how they experience the world.
Notice that we also have different data about each person: we don’t know the race of the first woman, we don’t know the parental status of the second woman, and there are many factors we don’t know about both of them. Applying an intersectionality lens means not only understanding all available dimensions of the data, but also noticing and addressing gaps in the data that could affect the results of a data science project.

A sampling of dimensions of identity; there are many more possible dimensions
Applying an intersectionality lens
The term “intersectionality” was coined in 1989 by Kimberlé Crenshaw, a scholar in critical race theory, in an analysis of earlier legal cases that failed to consider intersectional groups as worthy of protection. In one such case, a Black woman sued a manufacturing company for discriminating against her based on her identity as a Black woman, but the judge dismissed the case on the grounds that there was no discrimination because the company had hired female employees (white women in administrative positions) and the company had hired Black employees (Black men in industrial positions). The compounding obstacles created by the combination of race and gender discimination in this case were different for the plaintiff than for white women or Black men, but this injustice wasn’t recognized by the legal system. An intersectionality lens works to understand and peel back these overlapping layers of discrimination, helping facilitate more equitable results.
Though understanding identity groupings is key, an intersectionality lens doesn’t look at identity in a vacuum. Jane Coastan’s article on the history of this concept reminds us that “intersectionality operates as both the observance and analysis of power imbalances, and the tool by which those power imbalances could be eliminated altogether” (Jane Coastan, Vox). She highlights the three key ways to employ this lens: as an invitation to observe in greater detail, a framework to analyze meticulously, and a mechanism to push against systemic injustices. Adopting this perspective in your data science work means taking a deep look at how power dynamics between different identity groups manifest, examining those impacts in your data, and using your analysis to advance a more equitable result.
“Intersectionality operates as both the observance and analysis of power imbalances, and the tool by which those power imbalances could be eliminated altogether.”
To use this lens effectively, start by deepening your awareness of your own identity attributes (check out our resource guide for a useful framework). Without developing this awareness, you’re likely to miss key identity groups based on unconscious bias. For example, if you identify as non-religious but haven’t taken the time to reflect on this part of your identity, you’re less likely to consider how religious identities might affect your data science process (did you check if your data was collected during a major religious holiday?). Expanding your own identity awareness and learning techniques to avoid unconscious bias helps avoid situations like these. This will help open your eyes to areas you may not have considered previously, factors that your domain may not typically collect data about, and assumptions that you or others may make at various stages of a data science project. To fill in gaps in your understanding, build and advocate for a diverse and inclusive data science team, and consider soliciting feedback on your project from individuals from intersectional identity groups that aren’t represented on your team. But awareness is not enough: to conduct an equitable data science project, analyze these assumptions and use your findings to inform every stage of the data science project lifecycle.
Opportunities to address bias in the data science process
Because unconscious bias develops at an early age in individuals and affects our everyday behavior, data scientists have a responsibility to carefully consider how various types of biases impact the design of analytics, algorithms, and artificial intelligence tools. Bias can enter the data science process systemically, in how projects are funded or which identities are represented on a data science team; institutions need to address these structural inequities on a broader scale. As an individual data scientist, applying an intersectionality lens in your work is a means to fight bias and create more equitable outcomes. This lens comes into play at every stage of the data science project lifecycle:
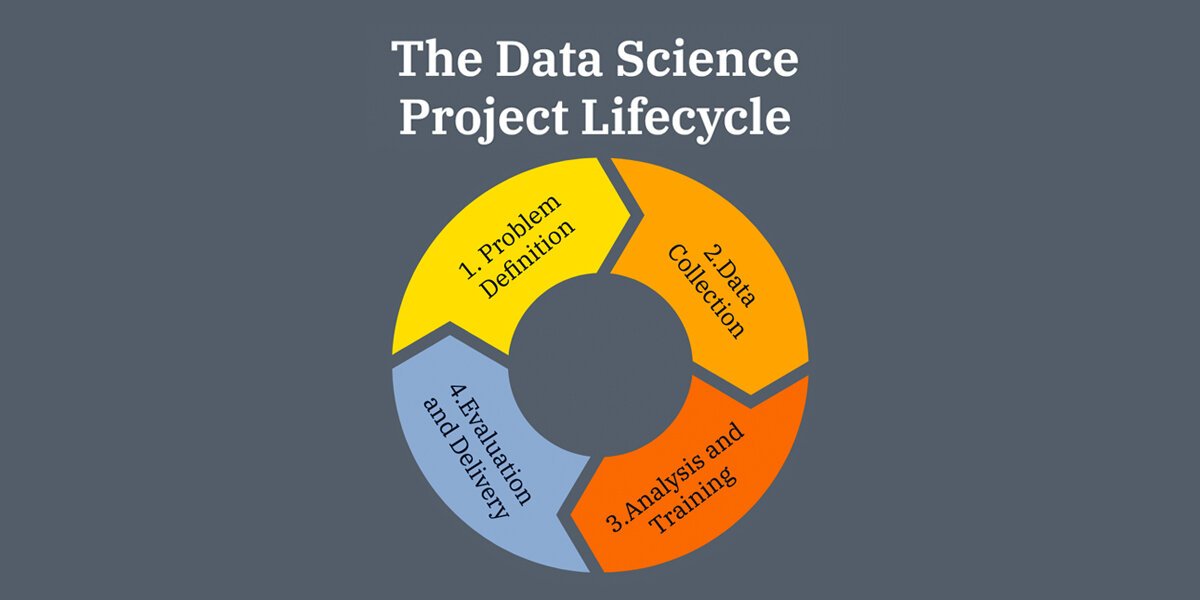
The data science project lifecycle
1. In the problem definition phase of a project, preconceived notions about the outcome or personal opinions can skew how questions are framed. To evaluate these assumptions, data scientists must determine whether their initial questions and guiding research points contain biases. Are the problem statements objective? Also at this stage, defining what an equitable outcome means for your particular project context will give you a baseline for evaluating your findings at the end of the project. If you have a diverse project team, be sure to get everyone’s input on the project definition so that your framing incorporates intersectional perspectives. If you’re still working on building a diverse project team, in the interim you can ask for input from data scientists in identity groups that aren’t represented on your team. Finally, this is a great time to get out of the office and interact with some of your stakeholders: customers, audience members, end users, or whoever your project is impacting. This is another great way to check your assumptions and avoid bias.
2. During data collection, seek out detailed data without making assumptions about what data can be grouped together. Comprehensive data can then be disaggregated, or analyzed in smaller intersectional subgroups, to accurately reflect the compounding effects of belonging to multiple identity groups. Disaggregation enables you to explore patterns in the data that may arise among intersectional identity groups, setting the stage for an equitable analysis.
3. The decisions made during the analysis phase of a project inform how the models are built, how the model’s features are designed and emphasized, and which interactions between features are addressed. Algorithms used in data science are only as good as the data they are given: providing biased data to an algorithm will only amplify that bias. When engineering features to be used in algorithm building, ensure that the features are inclusive and do not promote systemic oppression (check out this example of how data scientists at Meetup addressed this issue). Should the algorithm’s results not equitably reflect all appropriate identities, revisit the data collection or algorithm building process to identify the best way to reduce those biases.
4. The delivery and presentation of a project’s results may seem simple, but this final framing is key to fostering an equitable project outcome. Clearly defining the data sources, the assumptions made, and the intended use of the analysis can help prevent misinterpretation or a misapplication of the project’s findings. Finally, present key insights objectively – including insights that do not affirm your initial assumptions, because these findings may point to underlying biases in the project design to address in your next project.
Ground the data science lifecycle in intersectionality
Data science informs an ever-increasing number of domains and contexts: how products are designed, how resources are distributed, what recommendations are made, how marketing campaigns are tuned, and even predictions about how people will behave. As the tools of data science – from analytics to predictive algorithms to AI – continue to inform more areas of daily life, grounding every phase of the data science lifecycle in an inclusive, intersectional lens will promote fairness and equitable results.
For data scientists interested in actionable steps and resources on applying an intersectionality lens to their work, download our one-page guide to applying an intersectionality lens in data science.
About the authors

Daphne Cheung is a data scientist at The Walt Disney Company, working on predictive network and infrastructure analytics. She has volunteered as the analytics lead for Women@Disney, advancing women and talent mobility within Disney, and is currently a volunteer for LA Tech4Good. Daphne is an advocate for diversity and inclusion initiatives in the workplace and a proponent of the art of storytelling as a powerful tool in the data space.

Rachel Whaley is a data manager at the University of Southern California, building data and analytics tools to support student success. She is passionate about using technology to enable positive social impact, through her volunteer work with LA Tech4Good. Rachel is an outdoors enthusiast, and when she's not learning a new technology, she loves to explore LA's hiking trails and beaches.